
- LIVE QUOTES
- LEARN
- HELP
 Wall Street Journal
EN
A great week that adds to Provident Financial Services, Inc.'s (NYSE:PFS) one-year returns, institutional investors who own 69% must be happy
Key Insights
- Given the large stake in the stock by institutions, Provident Financial Services' stock price might be vulnerable to their trading decisions
- 51% of the business is held by the top 13 shareholders
- Recent purchases by insiders
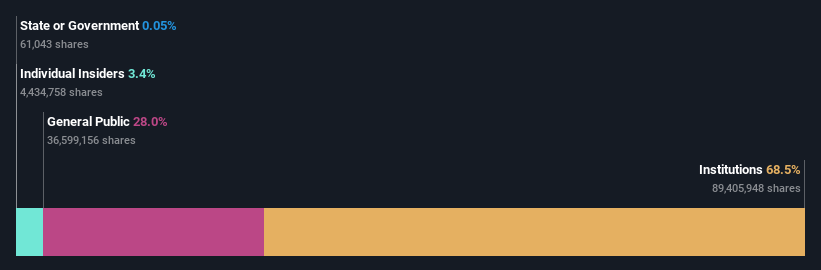
If you want to know who really controls Provident Financial Services, Inc. (NYSE:PFS), then you'll have to look at the makeup of its share registry. We can see that institutions own the lion's share in the company with 69% ownership. That is, the group stands to benefit the most if the stock rises (or lose the most if there is a downturn).
Last week’s 3.3% gain means that institutional investors were on the positive end of the spectrum even as the company has shown strong longer-term trends. One-year return to shareholders is currently 7.5% and last week’s gain was the icing on the cake.
Let's take a closer look to see what the different types of shareholders can tell us about Provident Financial Services.
Check out our latest analysis for Provident Financial Services
What Does The Institutional Ownership Tell Us About Provident Financial Services?
Institutions typically measure themselves against a benchmark when reporting to their own investors, so they often become more enthusiastic about a stock once it's included in a major index. We would expect most companies to have some institutions on the register, especially if they are growing.
As you can see, institutional investors have a fair amount of stake in Provident Financial Services. This can indicate that the company has a certain degree of credibility in the investment community. However, it is best to be wary of relying on the supposed validation that comes with institutional investors. They too, get it wrong sometimes. If multiple institutions change their view on a stock at the same time, you could see the share price drop fast. It's therefore worth looking at Provident Financial Services' earnings history below. Of course, the future is what really matters.

Investors should note that institutions actually own more than half the company, so they can collectively wield significant power. Hedge funds don't have many shares in Provident Financial Services. BlackRock, Inc. is currently the company's largest shareholder with 15% of shares outstanding. For context, the second largest shareholder holds about 11% of the shares outstanding, followed by an ownership of 6.1% by the third-largest shareholder.
A closer look at our ownership figures suggests that the top 13 shareholders have a combined ownership of 51% implying that no single shareholder has a majority.
While studying institutional ownership for a company can add value to your research, it is also a good practice to research analyst recommendations to get a deeper understand of a stock's expected performance. Quite a few analysts cover the stock, so you could look into forecast growth quite easily.
Insider Ownership Of Provident Financial Services
The definition of company insiders can be subjective and does vary between jurisdictions. Our data reflects individual insiders, capturing board members at the very least. The company management answer to the board and the latter should represent the interests of shareholders. Notably, sometimes top-level managers are on the board themselves.
Insider ownership is positive when it signals leadership are thinking like the true owners of the company. However, high insider ownership can also give immense power to a small group within the company. This can be negative in some circumstances.
We can report that insiders do own shares in Provident Financial Services, Inc.. This is a big company, so it is good to see this level of alignment. Insiders own US$69m worth of shares (at current prices). Most would say this shows alignment of interests between shareholders and the board. Still, it might be worth checking if those insiders have been selling.
General Public Ownership
With a 28% ownership, the general public, mostly comprising of individual investors, have some degree of sway over Provident Financial Services. While this size of ownership may not be enough to sway a policy decision in their favour, they can still make a collective impact on company policies.
Next Steps:
I find it very interesting to look at who exactly owns a company. But to truly gain insight, we need to consider other information, too. Like risks, for instance. Every company has them, and we've spotted 4 warning signs for Provident Financial Services (of which 1 makes us a bit uncomfortable!) you should know about.
If you are like me, you may want to think about whether this company will grow or shrink. Luckily, you can check this free report showing analyst forecasts for its future.
NB: Figures in this article are calculated using data from the last twelve months, which refer to the 12-month period ending on the last date of the month the financial statement is dated. This may not be consistent with full year annual report figures.
Have feedback on this article? Concerned about the content? Get in touch with us directly. Alternatively, email editorial-team (at) simplywallst.com.
This article by Simply Wall St is general in nature. We provide commentary based on historical data and analyst forecasts only using an unbiased methodology and our articles are not intended to be financial advice. It does not constitute a recommendation to buy or sell any stock, and does not take account of your objectives, or your financial situation. We aim to bring you long-term focused analysis driven by fundamental data. Note that our analysis may not factor in the latest price-sensitive company announcements or qualitative material. Simply Wall St has no position in any stocks mentioned.