
- LIVE QUOTES
- LEARN
- HELP
 Wall Street Journal
EN
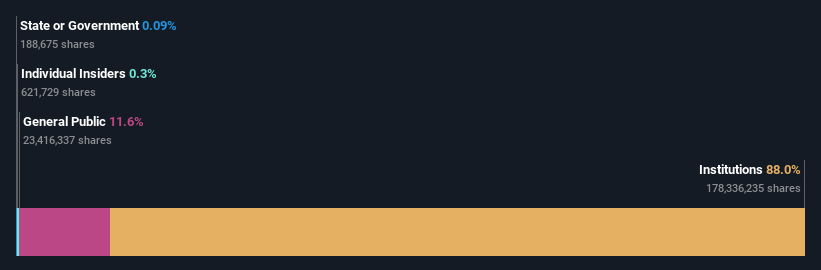
With 88% ownership of the shares, The Hershey Company (NYSE:HSY) is heavily dominated by institutional owners
Key Insights
- Given the large stake in the stock by institutions, Hershey's stock price might be vulnerable to their trading decisions
- The top 5 shareholders own 53% of the company
- Analyst forecasts along with ownership data serve to give a strong idea about prospects for a business
To get a sense of who is truly in control of The Hershey Company (NYSE:HSY), it is important to understand the ownership structure of the business. We can see that institutions own the lion's share in the company with 88% ownership. In other words, the group stands to gain the most (or lose the most) from their investment into the company.
Given the vast amount of money and research capacities at their disposal, institutional ownership tends to carry a lot of weight, especially with individual investors. Hence, having a considerable amount of institutional money invested in a company is often regarded as a desirable trait.
Let's delve deeper into each type of owner of Hershey, beginning with the chart below.
View our latest analysis for Hershey
What Does The Institutional Ownership Tell Us About Hershey?
Institutional investors commonly compare their own returns to the returns of a commonly followed index. So they generally do consider buying larger companies that are included in the relevant benchmark index.
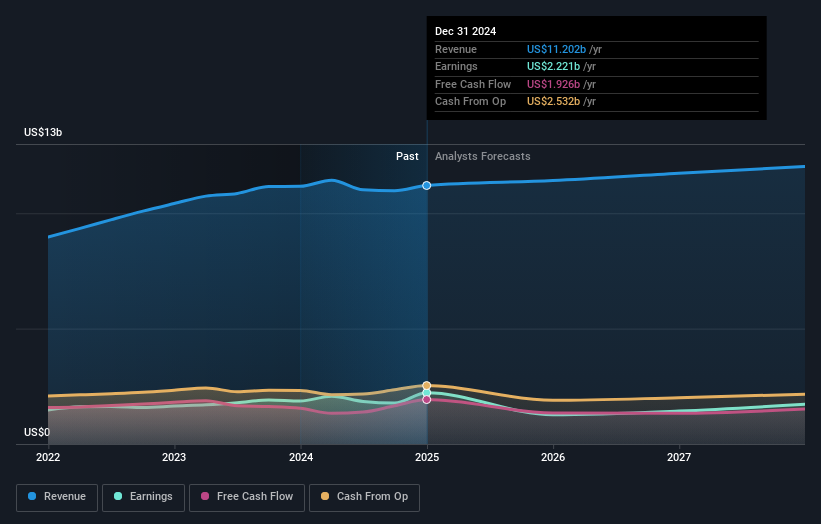
We can see that Hershey does have institutional investors; and they hold a good portion of the company's stock. This implies the analysts working for those institutions have looked at the stock and they like it. But just like anyone else, they could be wrong. When multiple institutions own a stock, there's always a risk that they are in a 'crowded trade'. When such a trade goes wrong, multiple parties may compete to sell stock fast. This risk is higher in a company without a history of growth. You can see Hershey's historic earnings and revenue below, but keep in mind there's always more to the story.
Institutional investors own over 50% of the company, so together than can probably strongly influence board decisions. We note that hedge funds don't have a meaningful investment in Hershey. Our data shows that Milton Hershey School Trust is the largest shareholder with 28% of shares outstanding. With 9.5% and 6.2% of the shares outstanding respectively, The Vanguard Group, Inc. and Capital Research and Management Company are the second and third largest shareholders.
Our research also brought to light the fact that roughly 53% of the company is controlled by the top 5 shareholders suggesting that these owners wield significant influence on the business.
Researching institutional ownership is a good way to gauge and filter a stock's expected performance. The same can be achieved by studying analyst sentiments. There are plenty of analysts covering the stock, so it might be worth seeing what they are forecasting, too.
Insider Ownership Of Hershey
The definition of company insiders can be subjective and does vary between jurisdictions. Our data reflects individual insiders, capturing board members at the very least. Company management run the business, but the CEO will answer to the board, even if he or she is a member of it.
Most consider insider ownership a positive because it can indicate the board is well aligned with other shareholders. However, on some occasions too much power is concentrated within this group.
Our data suggests that insiders own under 1% of The Hershey Company in their own names. As it is a large company, we'd only expect insiders to own a small percentage of it. But it's worth noting that they own US$102m worth of shares. Arguably recent buying and selling is just as important to consider. You can click here to see if insiders have been buying or selling.
General Public Ownership
The general public, who are usually individual investors, hold a 12% stake in Hershey. This size of ownership, while considerable, may not be enough to change company policy if the decision is not in sync with other large shareholders.
Next Steps:
I find it very interesting to look at who exactly owns a company. But to truly gain insight, we need to consider other information, too. Consider for instance, the ever-present spectre of investment risk. We've identified 2 warning signs with Hershey (at least 1 which is potentially serious) , and understanding them should be part of your investment process.
If you are like me, you may want to think about whether this company will grow or shrink. Luckily, you can check this free report showing analyst forecasts for its future.
NB: Figures in this article are calculated using data from the last twelve months, which refer to the 12-month period ending on the last date of the month the financial statement is dated. This may not be consistent with full year annual report figures.
Have feedback on this article? Concerned about the content? Get in touch with us directly. Alternatively, email editorial-team (at) simplywallst.com.
This article by Simply Wall St is general in nature. We provide commentary based on historical data and analyst forecasts only using an unbiased methodology and our articles are not intended to be financial advice. It does not constitute a recommendation to buy or sell any stock, and does not take account of your objectives, or your financial situation. We aim to bring you long-term focused analysis driven by fundamental data. Note that our analysis may not factor in the latest price-sensitive company announcements or qualitative material. Simply Wall St has no position in any stocks mentioned.