
- LIVE QUOTES
- LEARN
- HELP
 Wall Street Journal
EN
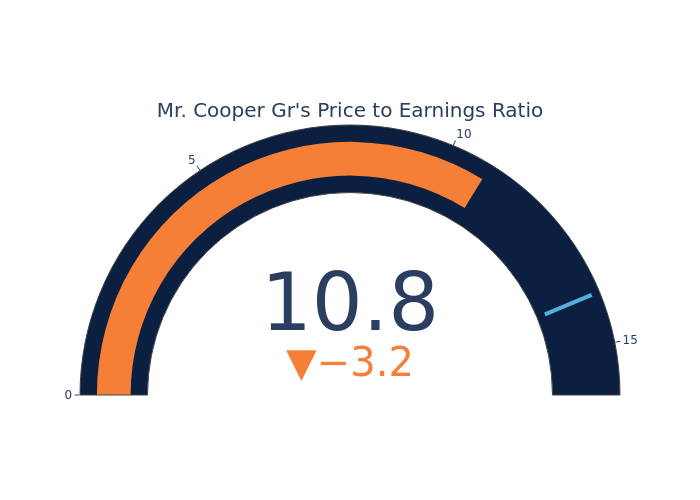
P/E Ratio Insights for Mr. Cooper Gr
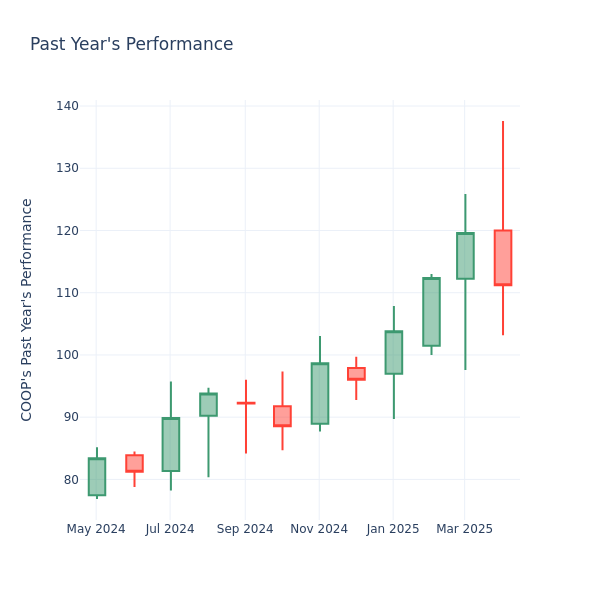
In the current market session, Mr. Cooper Gr Inc. (NASDAQ:COOP) stock price is at $111.21, after a 1.34% drop. However, over the past month, the company's stock spiked by 5.32%, and in the past year, by 43.40%. Shareholders might be interested in knowing whether the stock is overvalued, even if the company is not performing up to par in the current session.
Mr. Cooper Gr P/E Ratio Analysis in Relation to Industry Peers
The P/E ratio is used by long-term shareholders to assess the company's market performance against aggregate market data, historical earnings, and the industry at large. A lower P/E could indicate that shareholders do not expect the stock to perform better in the future or it could mean that the company is undervalued.
Mr. Cooper Gr has a lower P/E than the aggregate P/E of 14.0 of the Financial Services industry. Ideally, one might believe that the stock might perform worse than its peers, but it's also probable that the stock is undervalued.
In conclusion, the price-to-earnings ratio is a useful metric for analyzing a company's market performance, but it has its limitations. While a lower P/E can indicate that a company is undervalued, it can also suggest that shareholders do not expect future growth. Additionally, the P/E ratio should not be used in isolation, as other factors such as industry trends and business cycles can also impact a company's stock price. Therefore, investors should use the P/E ratio in conjunction with other financial metrics and qualitative analysis to make informed investment decisions.