
- LIVE QUOTES
- LEARN
- HELP
 Wall Street Journal
EN
Allegion (NYSE:ALLE) Has A Pretty Healthy Balance Sheet
David Iben put it well when he said, 'Volatility is not a risk we care about. What we care about is avoiding the permanent loss of capital.' When we think about how risky a company is, we always like to look at its use of debt, since debt overload can lead to ruin. We note that Allegion plc (NYSE:ALLE) does have debt on its balance sheet. But the real question is whether this debt is making the company risky.
What Risk Does Debt Bring?
Debt and other liabilities become risky for a business when it cannot easily fulfill those obligations, either with free cash flow or by raising capital at an attractive price. If things get really bad, the lenders can take control of the business. While that is not too common, we often do see indebted companies permanently diluting shareholders because lenders force them to raise capital at a distressed price. Of course, plenty of companies use debt to fund growth, without any negative consequences. The first thing to do when considering how much debt a business uses is to look at its cash and debt together.
What Is Allegion's Net Debt?
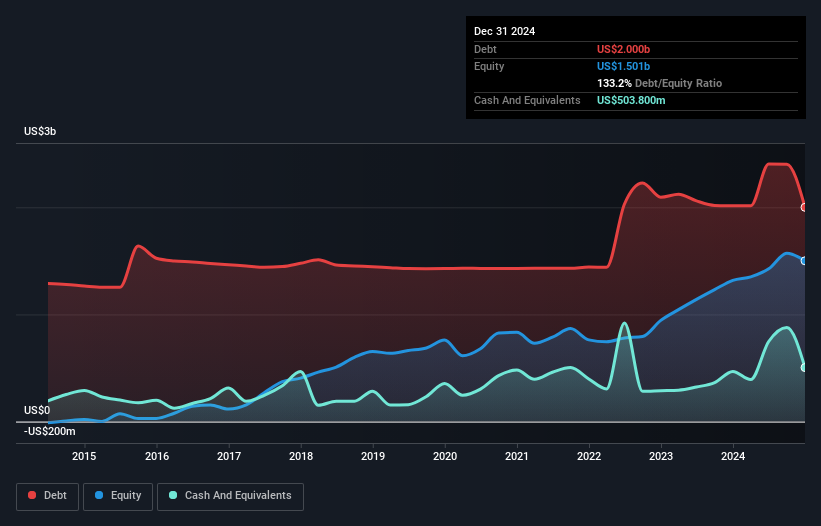
The chart below, which you can click on for greater detail, shows that Allegion had US$2.00b in debt in December 2024; about the same as the year before. However, it does have US$503.8m in cash offsetting this, leading to net debt of about US$1.50b.
How Strong Is Allegion's Balance Sheet?
Zooming in on the latest balance sheet data, we can see that Allegion had liabilities of US$696.9m due within 12 months and liabilities of US$2.29b due beyond that. Offsetting these obligations, it had cash of US$503.8m as well as receivables valued at US$448.7m due within 12 months. So it has liabilities totalling US$2.03b more than its cash and near-term receivables, combined.
Of course, Allegion has a titanic market capitalization of US$10.8b, so these liabilities are probably manageable. But there are sufficient liabilities that we would certainly recommend shareholders continue to monitor the balance sheet, going forward.
Check out our latest analysis for Allegion
We use two main ratios to inform us about debt levels relative to earnings. The first is net debt divided by earnings before interest, tax, depreciation, and amortization (EBITDA), while the second is how many times its earnings before interest and tax (EBIT) covers its interest expense (or its interest cover, for short). This way, we consider both the absolute quantum of the debt, as well as the interest rates paid on it.
With a debt to EBITDA ratio of 1.7, Allegion uses debt artfully but responsibly. And the alluring interest cover (EBIT of 9.7 times interest expense) certainly does not do anything to dispel this impression. The good news is that Allegion has increased its EBIT by 7.7% over twelve months, which should ease any concerns about debt repayment. When analysing debt levels, the balance sheet is the obvious place to start. But ultimately the future profitability of the business will decide if Allegion can strengthen its balance sheet over time. So if you're focused on the future you can check out this free report showing analyst profit forecasts.
Finally, a company can only pay off debt with cold hard cash, not accounting profits. So the logical step is to look at the proportion of that EBIT that is matched by actual free cash flow. Over the most recent three years, Allegion recorded free cash flow worth 69% of its EBIT, which is around normal, given free cash flow excludes interest and tax. This cold hard cash means it can reduce its debt when it wants to.
Our View
Happily, Allegion's impressive conversion of EBIT to free cash flow implies it has the upper hand on its debt. And the good news does not stop there, as its interest cover also supports that impression! Taking all this data into account, it seems to us that Allegion takes a pretty sensible approach to debt. That means they are taking on a bit more risk, in the hope of boosting shareholder returns. When analysing debt levels, the balance sheet is the obvious place to start. But ultimately, every company can contain risks that exist outside of the balance sheet. For example - Allegion has 1 warning sign we think you should be aware of.
If, after all that, you're more interested in a fast growing company with a rock-solid balance sheet, then check out our list of net cash growth stocks without delay.
Have feedback on this article? Concerned about the content? Get in touch with us directly. Alternatively, email editorial-team (at) simplywallst.com.
This article by Simply Wall St is general in nature. We provide commentary based on historical data and analyst forecasts only using an unbiased methodology and our articles are not intended to be financial advice. It does not constitute a recommendation to buy or sell any stock, and does not take account of your objectives, or your financial situation. We aim to bring you long-term focused analysis driven by fundamental data. Note that our analysis may not factor in the latest price-sensitive company announcements or qualitative material. Simply Wall St has no position in any stocks mentioned.