
- LIVE QUOTES
- LEARN
- HELP
 Wall Street Journal
EN
Transcontinental Realty Investors Full Year 2024 Earnings: EPS: US$0.68 (vs US$0.69 in FY 2023)
Transcontinental Realty Investors (NYSE:TCI) Full Year 2024 Results
Key Financial Results
- Revenue: US$47.8m (down 6.3% from FY 2023).
- Net income: US$5.86m (down 1.3% from FY 2023).
- Profit margin: 12% (in line with FY 2023).
- EPS: US$0.68 (down from US$0.69 in FY 2023).
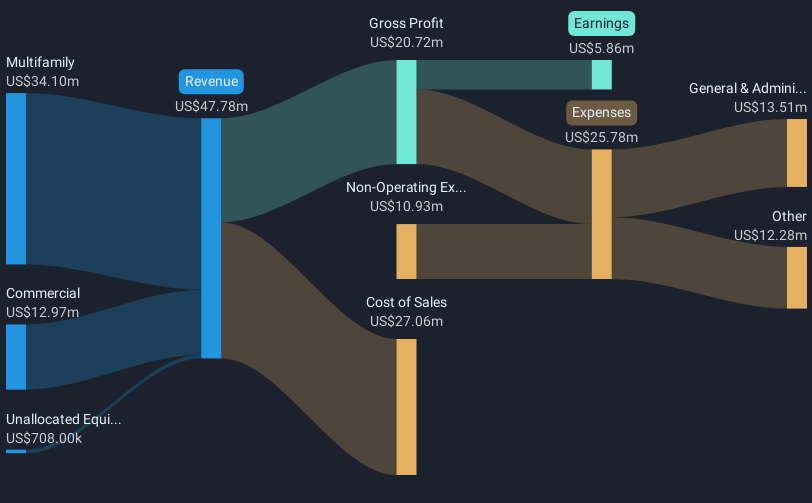
All figures shown in the chart above are for the trailing 12 month (TTM) period
The primary driver behind last 12 months revenue was the Multifamily segment contributing a total revenue of US$34.1m (71% of total revenue). Notably, cost of sales worth US$27.1m amounted to 57% of total revenue thereby underscoring the impact on earnings. The largest operating expense was General & Administrative costs, amounting to US$13.5m (52% of total expenses). Over the last 12 months, the company's earnings were enhanced by non-operating gains of US$10.9m. Explore how TCI's revenue and expenses shape its earnings.
Transcontinental Realty Investors shares are down 2.5% from a week ago.
Balance Sheet Analysis
While earnings are important, another area to consider is the balance sheet. We have a graphic representation of Transcontinental Realty Investors' balance sheet and an in-depth analysis of the company's financial position.
Have feedback on this article? Concerned about the content? Get in touch with us directly. Alternatively, email editorial-team (at) simplywallst.com.
This article by Simply Wall St is general in nature. We provide commentary based on historical data and analyst forecasts only using an unbiased methodology and our articles are not intended to be financial advice. It does not constitute a recommendation to buy or sell any stock, and does not take account of your objectives, or your financial situation. We aim to bring you long-term focused analysis driven by fundamental data. Note that our analysis may not factor in the latest price-sensitive company announcements or qualitative material. Simply Wall St has no position in any stocks mentioned.