
- LIVE QUOTES
- LEARN
- HELP
 Wall Street Journal
EN
MDU Resources Group Full Year 2024 Earnings: EPS Beats Expectations, Revenues Lag
MDU Resources Group (NYSE:MDU) Full Year 2024 Results
Key Financial Results
- Revenue: US$1.76b (down 2.5% from FY 2023).
- Net income: US$181.1m (down 45% from FY 2023).
- Profit margin: 10% (down from 18% in FY 2023). The decrease in margin was primarily driven by higher expenses.
- EPS: US$0.89 (down from US$1.62 in FY 2023).
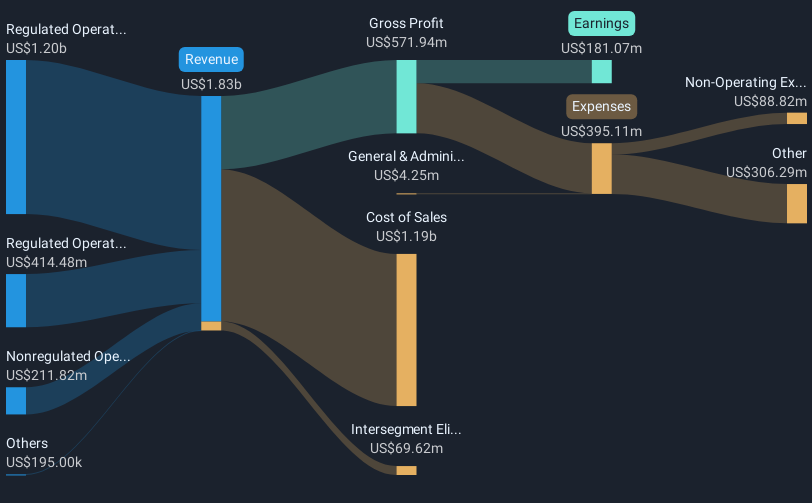
All figures shown in the chart above are for the trailing 12 month (TTM) period
MDU Resources Group EPS Beats Expectations, Revenues Fall Short
Revenue missed analyst estimates by 57%. Earnings per share (EPS) exceeded analyst estimates by 19%.
The primary driver behind last 12 months revenue was the Regulated Operations - Natural Gas Distribution segment contributing a total revenue of US$1.20b (68% of total revenue). Notably, cost of sales worth US$1.19b amounted to 67% of total revenue thereby underscoring the impact on earnings. The largest operating expense was Depreciation & Amortisation (D&A) costs, amounting to US$200.1m (51% of total expenses). Explore how MDU's revenue and expenses shape its earnings.
Looking ahead, revenue is forecast to grow 4.6% p.a. on average during the next 3 years, compared to a 5.9% growth forecast for the Gas Utilities industry in the US.
Performance of the American Gas Utilities industry.
The company's shares are down 1.3% from a week ago.
Risk Analysis
We should say that we've discovered 3 warning signs for MDU Resources Group (1 makes us a bit uncomfortable!) that you should be aware of before investing here.
Have feedback on this article? Concerned about the content? Get in touch with us directly. Alternatively, email editorial-team (at) simplywallst.com.
This article by Simply Wall St is general in nature. We provide commentary based on historical data and analyst forecasts only using an unbiased methodology and our articles are not intended to be financial advice. It does not constitute a recommendation to buy or sell any stock, and does not take account of your objectives, or your financial situation. We aim to bring you long-term focused analysis driven by fundamental data. Note that our analysis may not factor in the latest price-sensitive company announcements or qualitative material. Simply Wall St has no position in any stocks mentioned.